It is getting cooler and cooler. Sorry – I mean that Global Warming is an imminent treat to humankind.
It is four months since I last checked the OFFICIAL USA temperature figures and now the official January temperature figures are out.
So I thought I dive into it. As usual I thought it would be interesting to look at the recent January US temperature from a “historic” perspective. To see how the decade trends have evolved during the last 113 years
Especially to see how the decade trends have evolved during the last 43 years. The period that according to the Global Warming Hysterics and computer models they worship should show a steady and accelerated increase in temperature.
And as I always point out:
Remember, these are the official figures. With the poor placement of stations (91 % of the stations are CRN 3 to 5 = bad to very poor); where they have purposely taken away the urban heat island effect, use huge smoothing radius, the historical “adjustment and tweaking” to cool the past etc.
Not to mention the great slaughter of GHCN stations 1990-1993 – roughly 63 % of all stations were “dropped”. Oddly enough many of them in cold places – Hmmm? Now the number of GHCN stations is back at the same numbers as in 1890.
Also remember that the US stations are now nearly a third of the all GHCN world stations.
So here are the trends:
US temperature January 1900-2013
The trend for 1900 to 2013 is 0.11 F / Decade

US temperature January 1970-2013
The trend for 1970 to 2013 is 1.13 F / Decade

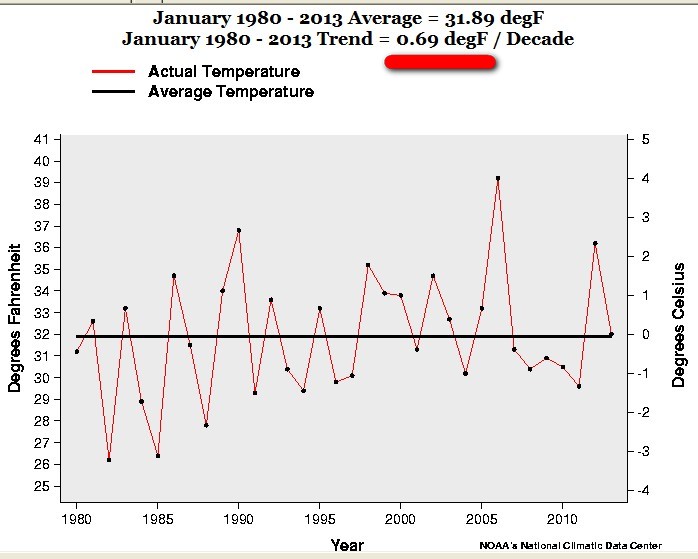
US temperature January 1980-2013
The trend for 1980 to 2013 is 0.69 F / Decade
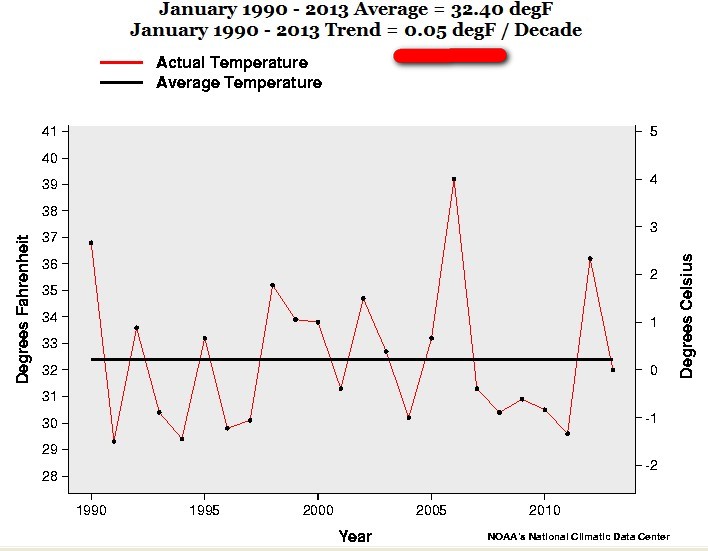
US temperature January 1990-2013
The trend for 1990 to 2013 is 0.05 F / Decade
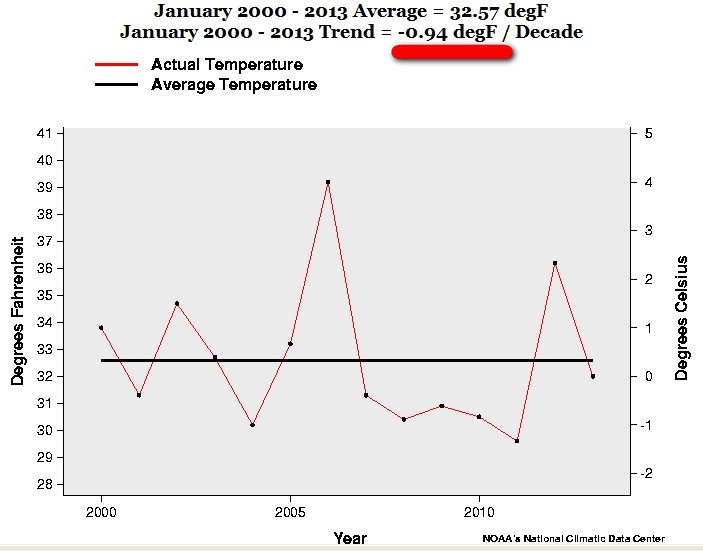
US temperature January 2000-2013
The trend for 2000 to 2013 is – 0.94 F / Decade
You REALLY, REALLY can see the accelerating trend can you not?
And as I said in the beginning – always remember that these figures are based on the official data that has been tweaked, “adjusted” and manipulated to fit their agenda (cool the past, ignore UHI and land use change factors, huge smoothing radius – 1200km etc.)..
So the “warming trend” 2000-2013 for January is exactly – 0.94 F degrees a decade. That is a – 9.4 F COOLER in 100 years. That’s what I call “warming”!
According to the computer models that the Global Warming Hysterics love so much, worship and blindly follows (especially our intelligent politicians), it should be EXACTLY the opposite.
And we are supposed to be very worried about a predicted rise of 3-4 F?
But not this ACTUAL trend?
And for this predicted trend the politicians want to take our societies back to the Stone Age. But, as usual, they DO NOTHING about the actual trend.
Even worse, “our” politicians, “scientists”, “journalists” and the mainstream medias attitude is: Move on, NOTHING to see here.
As I have been saying all along, it has always been a political agenda – anti human, anti freedom, anti development and anti capitalism. And this Global Warming Hysteria is part of that agenda. It has nothing to do with science, facts or saving the environment or the Earth.
All of this, as always, paid by us, the common people, in the form of taxes, high energy costs and reducing our living standard back to the Stone Age.
So to summarize this evidence of January ”accelerated warming” trend:
The January trend 1970-2013 is exactly 1.13 F degrees a decade.
The January trend 1980-2013 is exactly 0.69 F degrees a decade.
The January trend 1990-2013 is exactly 0.05 F degrees a decade.
The January trend 2000-2013 is exactly – 0.94 F degrees a decade.
Another brilliant and glorious example of RAPID WARMING and an eminent treat to humankind! Especially during the last 43 years.
That is truly “Global Warming” US style.
An interesting ”science” wouldn’t you say.
This is the “stuff” that “Global Warming” is made of.
Läs även andra bloggares åsikter om http://bloggar.se/om/milj%F6” rel=”tag”>miljö</a>, <a href=” http://bloggar.se/om/yttrandefrihet” rel=”tag”>yttrandefrihet</a>, <a href=”http://bloggar.se/om/fri-+och+r%E4ttigheter” rel=”tag”>fri- och rättigheter, Läs även andra bloggares åsikter om <a href=” http://bloggar.se/om/USA” rel=”tag”>USA</a>

Etiketter: adjustment, average temperature, climate record, Climate Reference Network, climate stations, Continental U.S., cool the past, CRN, Departure from normal, eminent treat to humankind, GHCN, GISS, Global temperature, Global Temperature Trends, Global Warming Hysteria, Goddard Institute of Space Flight, historical record, huge smoothing radius, January temperature, January temperature trend, land use change factors, measurement biases, NASA, NCDC, poor placement of stations, quality control, regional climate change, Regional temperature, Site Information Handbook, smoothing radius, State high temperature records, Surface stations, Temperaturdata, Temperature data, temperature measurement, the National Climatic Data Center, thermometers, trend per decade, Trends per decade, tweaking, U.S.Temperature, U.S.Temperature Trend, UAH, UHI, Urban Heat Island, US high temperature, US low temperature, USHCN, weather stations

2 mars, 2013 kl. 3:56 e m |
I’d like to thank you for the efforts you have put in writing this site. I am hoping to check out the same high-grade blog posts by you later on as well. In truth, your creative writing abilities has inspired me to get my own website now 😉
8 mars, 2013 kl. 3:07 e m |
Wonderful, what a blog it is! This website gives valuable facts to us, keep it up.
11 mars, 2013 kl. 10:27 e m |
[…] official February temperature figures are out. And as a complement to my previous post January U.S. Temperature trend/decade: – 9.4 F COOLER in 100 years, I thought I dive into […]
17 mars, 2013 kl. 5:53 e m |
google…
January U.S. Temperature trend/decade: – 9.4 F COOLER in 100 years | UD/RK Samhälls Debatt…
23 januari, 2014 kl. 7:55 e m |
[…] January U.S. Temperature trend/decade: – 9.4 F COOLER in 100 years […]