Som ett komplement till mina tidigare inlägg bl.a.: 422 700 år av temperaturdata från Antarktis, Temperaturen för 130 000 år sedan och Temperature data – What it really means., som handlade om Vostok Ice Core temperatur data. Kommer här en mera detaljerad genomgång av Vostok datat uppsplittrat på 50 000 års intervaller.
Se även: GLOBAL TEMPERATURE TRENDS FROM 2500 B.C. TO 2008 A.D., Global Warming: Has the Climate Sensitivity Holy Grail Been Found?, This is what the Global Warming Hysteria is all about – 0,03%!, A Climate of Belief – The Story of Climate models!, Study of Greenland Ice Finds Rapid Change in Past Climate, NOAA Cherry Picking on Trend Analyses, The Spatial Pattern and Mechanisms of Heat-Content Change in the North Atlantic, Ytvattentemperaturen i Atlanten utanför Central Amerika de senaste 32 000 åren., Assessment of the reliability of climate predictions based on comparisons with historical time series, Cold in the tropical troposphere but it should be warming if Global Warming ”theories” are correct!, Average Day By Day Variations Of The Global And Hemispheric Average Lower Tropospheric Temperatures, 2 miljarder år av temperaturdata!, Rewriting Temperature History – Time and Time Again!, Has the IPCC inflated the feedback factor?, Outstanding Job That Anthony Watts Has Done On Documenting The Immediate Environment Of Suface Temperature Monitoring Sites, The wonderful benefits of CO2!, När CO2 var som störst var temperaturen som lägst!
Observera att det är bara några få procent under dessa 422 700 år som temperatur variationen har legat ÖVER 0 grader.
Global Warming anyone?
http://joannenova.com.au/global-warming/ice-core-graph/
Orginal data här:
http://cdiac.ornl.gov/ftp/trends/temp/vostok/vostok.1999.temp.dat
Och här:
http://cdiac.ornl.gov/ftp/trends/co2/vostok.icecore.co2
The 800 year lag – graphed
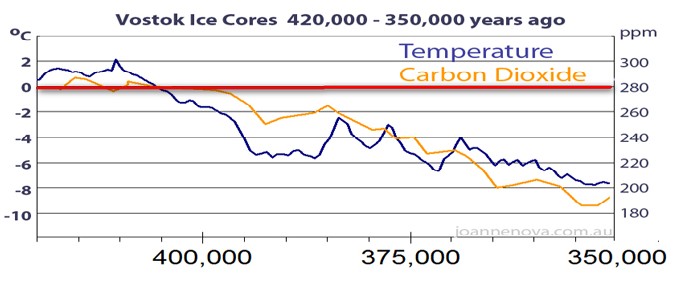
Carbon follows temperature in the Vostok Ice Cores
In the 1990’s the classic Vostok ice core graph showed temperature and carbon in lock step moving at the same time. It made sense to worry that carbon dioxide did influence temperature. But by 2003 new data came in and it was clear that carbon lagged behind temperature. The link was back to front. Temperatures appear to control carbon, and while it’s possible that carbon also influences temperature these ice cores don’t show much evidence of that. After temperatures rise, on average it takes 800 years before carbon starts to move. The extraordinary thing is that the lag is well accepted by climatologists, yet virtually unknown outside these circles. The fact that temperature leads is not controversial. It’s relevance is debated.
It’s impossible to see a lag of centuries on a graph that covers half a million years so I have regraphed the data from the original sources, here and here, and scaled the graphs out so that the lag is visible to the naked eye. What follows is the complete set from 420,000 years to 5,000 years before the present.
NOTE 1: What really matters here are the turning points, not the absolute levels.
NOTE 2: The carbon data is unfortunately far less detailed than the temperature data.
Beware of making conclusions about turning points
or lags when only one single point may be involved.
NOTE 3: The graph which illustrates the lag the best, and also has the most carbon data is 150,000-100,000 years ago.
The bottom line is that rising temperatures cause carbon levels to rise. Carbon may still influence temperatures, but these ice cores are fairly neutral on that. If both factors caused each other to rise, positive feedback would become exponential fast. We’d see a runaway greenhouse effect. It hasn’t happened. Some other factor is more important than carbon dioxide.
Klicka på graferna så blir de större!


Och så här såg min mera sammanpressade graf ut:
Klicka på bilden så blir den större


Update!
Two weeks after I started this scientific poll the result are as follows:
Bring Global Warming ON – Please, Please! -100%
Nä tack. Jag föredrar lovikavantar och pälsmössa – 0%
If this whoping trend continues, I have to notify IPCC and Al Gore of this, as yet, unreported BIG shift in the opinion.
Läs även andra bloggares åsikter om <a href=”http://bloggar.se/om/milj%F6” rel=”tag”>miljö</a>
Etiketter: Temperaturdata

10 november, 2008 kl. 10:54 e m |
[…] inflated the feedback factor?, IPCC and its bias!, Peer Review – What it actually means, The 800 year lag of carbon compared to temperature, Atmospheric CO2 and Climate on Millennial Time Scales During the Last […]
29 mars, 2009 kl. 1:56 f m |
[…] The 800 year lag of carbon compared to temperature […]
5 april, 2009 kl. 2:33 e m |
[…] The 800 year lag of carbon compared to temperature […]
24 maj, 2009 kl. 6:02 e m |
[…] The 800 year lag of carbon compared to temperature […]
7 augusti, 2009 kl. 10:07 e m |
[…] The 800 year lag of carbon compared to temperature […]